2016 Black-White Income Metro
Black-White Income Equality
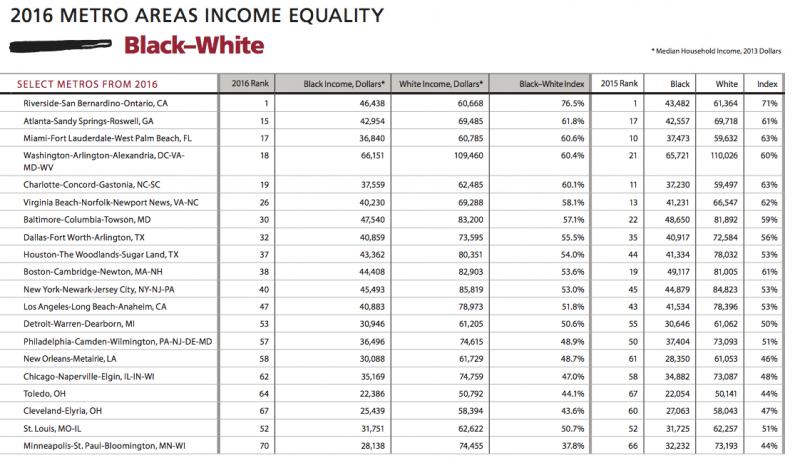
Unlike the Black-white unemployment equality rankings, the Black-White Income Equality Index rankings were relatively stable between 2015 and 2016. Six of last year’s top 10 metros were again in the top 10 this year. In the Hispanic-white rankings, seven of last year’s top 10 appear at the top of this year’s list. The full list of Black-white and Hispanic-white 2016 Metro Income Equality Index rankings, complete with a comparison to 2015, can be found in additional tables on www.stateofblackamerica.org.
Riverside-San Bernardino-Ontario, CA remained at the top of the Black-White Income Equality ranking this year, with the median Black household having 76 cents for every dollar of median white household income. In Riverside, Black household income rose 6.8 percent year-over-year while whites saw a decline of 1.1 percent. Black and white incomes were least equal in Minneapolis-St. Paul-Bloomington, MN-WI where the gap was 38 cents on the dollar. Minneapolis replaces San Francisco-Oakland-Hayward, CA as the metro where black and white incomes were least equal. In Minneapolis, the median household income for Blacks was $28,138 (down 12.7 percent from last year’s Index) compared to $74,455 for whites (up 1.7 percent from last year’s Index).
The highest median household income for both Blacks ($66,151) and whites ($109,460) was in Washington-Arlington-Alexandria, DC-VA-MD-WV, #18 in the ranking. The lowest median Black household income ($22,386) was in Toledo, OH (#64 in the ranking). Even though Toledo had one of the lowest median white household incomes in the country, white household income in Toledo was still more than double Black household income. Toledo, OH also had the fourth highest Black unemployment rate, which would at least partly account for the low income of Black households. The lowest median white household income for whites ($47,208) was in Lakeland-Winter Haven, FL.

Related Resources:

 Equality Index
  Senate Report
  2020 SOBA Essays
  2019 Report