
Black-White Unemployment Metro - 2015
Last year, the National Urban League introduced rankings of unemployment and income equality between whites, Blacks and Latinos in the nation’s largest metropolitan areas. Comparison of the 2014 and 2015 Metro Unemployment Equality Index rankings reveals that there was quite a bit of shuffling of metros at the top of the list1. In the Black–White rankings, only three of the cities in last year’s top 10 were also in this year’s top 10. In the Hispanic–White rankings, only four of last year’s top 10 metros remained at the top of this year’s list. On the other hand, many of the metros at the bottom of last year’s rankings remained at the bottom of this year’s rankings as well.
These patterns seem to represent differences in the pace of recovery across the country as metros at the top of the list averaged larger improvements in unemployment rates than those at the bottom of the list.
The tables herein highlight major cities, as well as the most and least equal metropolitan areas and those with highest and lowest unemployment.

BLACK-WHITE
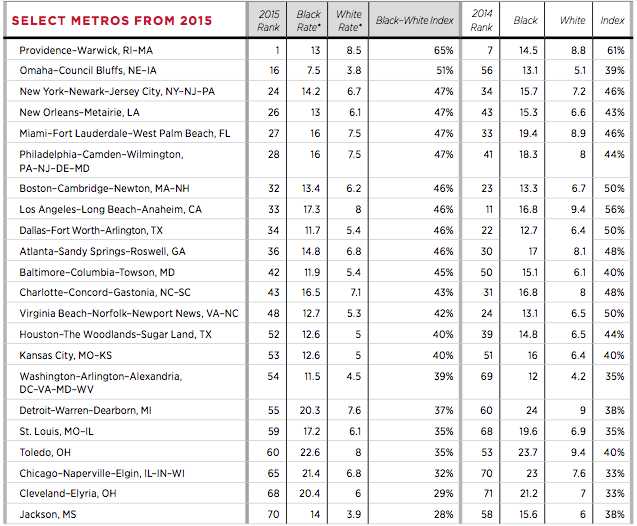
With an index of 65 percent, the smallest Black–white unemployment gap was in the Providence Warwick, RI–MA metro area, where the Black unemployment rate was 13 percent and the white rate was 8.5 percent. Last year’s most equal metro—Augusta–Richmond County, GA–SC—fell to #13 this year as the Black unemployment rate increased from 13 percent to 17 percent and the white unemployment rate was essentially unchanged.
Similar to the 2014 rankings, the 2015 rankings reveal that metros with the greatest unemployment equality are not necessarily the metros with the best employment outcomes for either group. The metro with the lowest unemployment rate for both Blacks and whites (7.5% and 3.8%, respectively) was Omaha–Council Bluffs, NE–IA, #16 in the equality ranking. The metro with the highest Black unemployment rate (23%) was Toledo, OH, #60 in the equality ranking. Riverside–San Bernardino–Ontario, CA registered the highest white unemployment rate (10.8%) and came in at #4 in the equality ranking.
NOTES
1The unemployment and income data used for the Metro Index rankings comes
from the American Community Survey (ACS). The 2015 Metro Index is based on
data from the 2013 ACS (most recent) and the 2014 Metro Index is based on data
from the 2012 ACS.
 Equality Index
  Senate Report
  2020 SOBA Essays
  2019 Report