The State of Black America, the National Urban League’s seminal annual publication now in its 40th edition, has become one of the most highly-anticipated benchmarks and sources for thought leadership around racial equality in America across economics (including employment, income and housing), education, health, social justice and civic engagement. Each edition of the State of Black America contains thoughtful commentary and insightful analysis from leading figures and thought leaders in politics, the corporate arena, NGOs, academia and popular culture.
Why does the National Urban League publish an Equality Index?
Economic empowerment is the central theme of the National Urban League’s mission. The Equality Indexgives us a way to document progress towards this mission. This year – the 40th anniversary of the State of Black America report – in addition to the Equality Indices of Black and Hispanic America, the National Urban League introduced a 40-year retrospective of key Black-White Equality Index numbers.
What is the Equality Index trying to do?
Imagine if we were to summarize how well African Americans and Hispanics are doing compared to whites in the areas of economics, health, education, social justice and civic engagement, and represent that by a pie. The Equality Index measures the share of that pie which African Americans and Hispanics get. Whites are used as the benchmark because the history of race in America has created advantages for whites that continue to persist in many of the outcomes being measured.
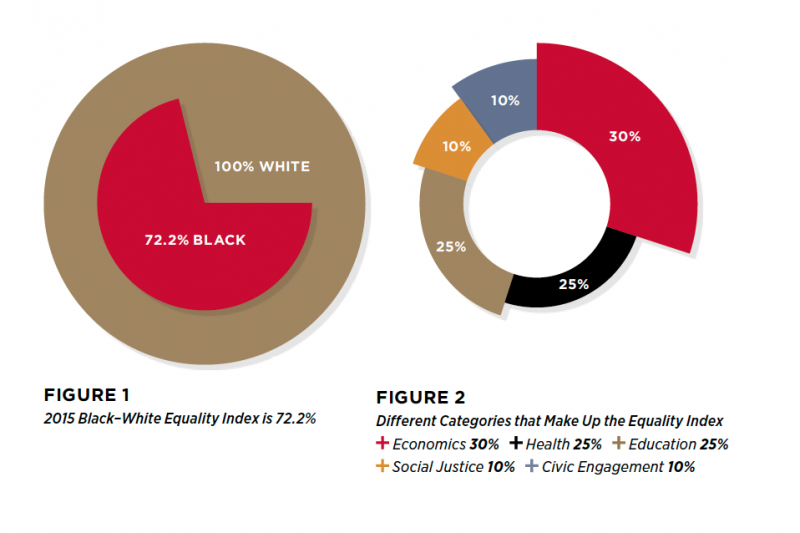
The 2016 Equality Index of Black America is 72.2%. What does that mean?
That means that rather than having a whole pie (100%), which would mean full equality with whites in 2016, African Americans are missing about 28% of the pie (Figure 1). Similarly, a Hispanic Index of 77.8% indicates that more than 20% of the pie is missing for Hispanics.

How is the Equality Index calculated?
The categories that make up the Equality Index are economics, health, education, social justice and civic engagement. In each, we calculate how well African Americans and Hispanics are doing relative to whites and add them to get the total Equality Index. Each category is weighted based on the importance that we give to each (Figure 2).
Is it possible to see how well African Americans and Hispanics are doing in each of the categories?
Yes. We show this in the tables included with the Equality Index. We estimate an index for each category that can be interpreted in the same way as the total Equality Index. So, an index of 56.2% for the economics category for African Americans in 2016 means that African Americans are missing close to half of the economics mini-pie. The table below summarizes the total 2016 Equality Index and the index in each category for African Americans and Hispanics.
Figure 3. 2016 National Equality Index
|
Category |
Black-White | Hispanic-White |
| Total Equality Index | 72.2% | 77.8% |
| Econmics | 56.2% | 61.8% |
| Health | 79.4% | 105.5% |
| Education | 77.4% | 74.2% |
| Social Justice | 60.8% | 75.9% |
| Civic Engagement | 100.6% | 67.6% |
Not all African Americans are doing poorly and not all whites are doing well. Why doesn’t the Equality Index capture class differences?
The National Equality Index was created to capture racial inequality. Most of the data points are reported as averages for African Americans, Hispanics and whites. An average is the easiest way to summarize a large amount of information, but can mask class differences within each group. While the Equality Index does not detail class differences, it does highlight regional differences in racial inequality through our rankings of metro area unemployment and income inequality. Additional Equality Index data for approximately 80 metro areas with large African-American and Hispanic are available upon request.
What should I do next?
Support the work of the National Urban League as we continue to advance policies and programs to empower African-American and other urban communities.

 Equality Index
  Senate Report
  2020 SOBA Essays
  2019 Report