Black-White Unemployment Metro Ranking - 2016
As President Obama wraps up the final months of his second term as the nation’s first African-American president, many will begin to assess the progress the nation has made under his administration, and more specifically, the progress that Black America has made. In making these critical assessments, we must also consider which presidential candidate is best suited to meet the challenges and seize the opportunities that lie ahead for the United States. How well has the nation recovered from the worst economic crisis it has seen in generations? How much closer to the goal of universal healthcare coverage has the Affordable Care Act – or Obamacare – gotten us? Have racial justice and overall race relations worsened or improved over the last eight years? Will the next policy era be one that reduces or exacerbates decades of growing income and wealth inequality? The 2016 National Urban League Equality Index tells an all too familiar story of persistent racial disparities in American life, making clear that the historic Obama presidency has not been a panacea for America’s long-standing race problem.
Overview of 2016 National Urban League Equality Index
Black-White
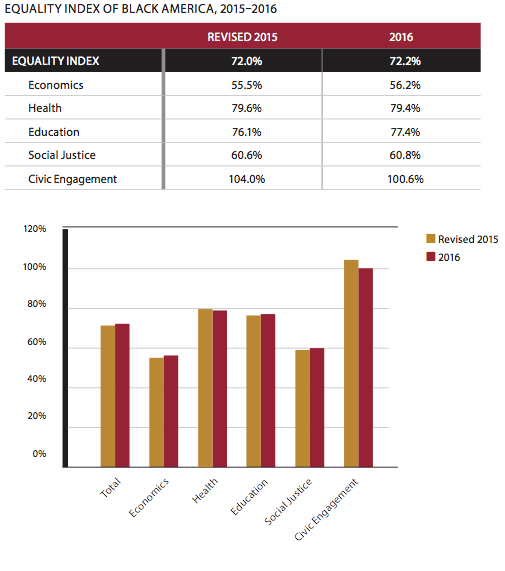
The 2016 Equality Index of Black America stands at 72.2 percent compared to a revised 2015 index of 72.0 percent. Revisions to the previous year’s index are done for greater comparability across years and reflect data points that have been corrected, removed from the current year’s index or re-weighted so that less emphasis is placed on older data. The largest increase in this year’s index was in the area of education (from 76.1% to 77.4%), with smaller increases in economics (from 55.5% to 56.2%) and social justice (60.6% to 60.8%). The civic engagement index declined sharply over the last year (from 104.0% to 100.6%) while the health index (from 79.6% to 79.4%) declined slightly.
The increase in the education index was the result of improvements in college attainment and enrollment. The increase in the economics index came primarily through progress in closing the digital divide as well as lower denial rates for African Americans seeking mortgage and home improvement loans. The unemployment and homeownership gaps remained unchanged from the previous year. The improvements in the social justice index resulted from a decline in the black incarceration rate, while the percent of whites placed in prison following an arrest grew by more than the rate for blacks.
The large drop in the civic engagement index resulted from the typical decline in voter registration and participation that are characteristics of mid-term election years.

Metropolitan Area Rankings of Unemployment Equality
Two years ago, the National Urban League introduced rankings of unemployment and income equality between whites, Blacks and Latinos in the nation’s largest metropolitan areas. Comparison of the 2015 and 2016 Metro Unemployment Equality Index rankings reveals that there was significant shuffling of metros at the top of the list. In both the Black-white and Hispanic-white rankings, only three of the cities in last year’s top 10 were also in this year’s top 10. On the other hand, many of the metros at the bottom of last year’s rankings remained at the bottom of this year’s rankings as well.
These patterns seem to represent differences in the pace of recovery across the country as metros at the top of the list averaged larger improvements in unemployment rates than those at the bottom of the list, especially among blacks and Latinos. The full list of Black-white and Hispanic-white 2016 Metro Unemployment Equality Index rankings, complete with a comparison to 2015, can be found in additional tables on www.stateofblackamerica.org.
Black-White Unemployment Equality
With an index of 68.7 percent, the Providence-Warwick, RI-MA metro area once again tops the list as the metro area with the smallest Black-white unemployment gap. The Black unemployment rate in Providence was 9.9 percent (down 3.1 percentage points) and the white rate was 6.8 percent (down 1.7 percentage points). With an index of 67 percent, this year’s second most equal metro area, Chattanooga, TN-GA, is up from #51 last year, reflecting a decline of more than 6 percentage points in the area’s black unemployment rate, while the white rate was virtually unchanged.
Similar to the 2015 rankings, the 2016 rankings reveal that metros with the greatest unemployment equality are not necessarily the metros with the best employment outcomes for either group. The metros with the lowest unemployment rate for Blacks (8.3 percent) were San Antonio-New Braunfels, TX and Oklahoma City, OK, #6 in the equality ranking. The metro with the lowest white unemployment rate (3.7 percent) was Jackson, MS, #65 in the equality ranking. The metro with the highest Black unemployment rate (20 percent) was Cleveland-Elyria, OH, #69 in the equality ranking. Riverside-San Bernardino-Ontario, CA registered the highest white unemployment rate (9.7 percent) and came in at #5 in the equality ranking.
Related Resources:

 Equality Index
  Senate Report
  2020 SOBA Essays
  2019 Report