Hispanic-White Unemployment Metro Ranking - 2016
Hispanic-White Unemployment
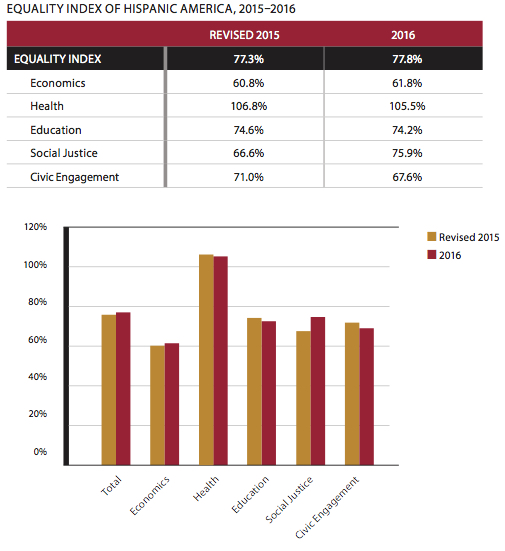
The 2016 Equality Index of Hispanic America stands at 77.8 percent compared to a revised 2015 index of 77.3 percent. The increase in the Hispanic-White Index resulted from a major improvement in the social justice index (from 66.6% to 75.9%) and smaller gain in the economics index (from 60.8% to 61.8%) that helped to offset losses in all other categories. The greatest losses were in civic engagement (from 71.0% to 67.6%), followed by health (from 106.8% to 105.5%), and education (from 74.6% to 74.2%).
The large increase in the social justice index was the result of improvements on nearly every measure of social justice used to calculate the Equality Index. Similar to the trends in the Equality Index of Black America, the increase in the economics index came from a smaller digital divide and fewer mortgage and home improvement loan denials.
On the other hand, Hispanic voter registration and participation dropped sharply during the mid-term elections in 2014 (latest data available), resulting in a decline in the civic engagement index. While the Hispanic-white health index remains above 100 percent and rates of uninsurance are falling among all groups, declining index values reflect faster health insurance take-up rates among whites than Latinos.

Metropolitan Area Rankings of Unemployment Equality
Two years ago, the National Urban League introduced rankings of unemployment and income equality between whites, Blacks and Latinos in the nation’s largest metropolitan areas. Comparison of the 2015 and 2016 Metro Unemployment Equality Index rankings reveals that there was significant shuffling of metros at the top of the list [i]. In both the Black-white and Hispanic-white rankings, only three of the cities in last year’s top 10 were also in this year’s top 10. On the other hand, many of the metros at the bottom of last year’s rankings remained at the bottom of this year’s rankings as well.
These patterns seem to represent differences in the pace of recovery across the country as metros at the top of the list averaged larger improvements in unemployment rates than those at the bottom of the list, especially among blacks and Latinos. The full list of Black-white and Hispanic-white 2016 Metro Unemployment Equality Index rankings, complete with a comparison to 2015, can be found in additional tables on www.stateofblackamerica.org.
Related Resources:

 Equality Index
  Senate Report
  2020 SOBA Essays
  2019 Report